


What We Google Reflects What We Fear: A 10-Year Look at America’s Anxiety through Trends, Correlation Networks and Granger Causality
We explore how rising concerns—like AI taking jobs—relate to public anxiety using time-series data and correlation. Granger causality comes in Part 2.

Introduction
In an age where public discourse moves fast and unpredictably, Google search data offers a unique window into the collective mind. What we type into the search bar, especially in times of uncertainty, reveals not just our interests, but our fears, confusions, and the social forces shaping them.
This article explores the emotional and behavioral patterns behind a decade of search data in the United States. We examine how people have searched for terms related to mental health, economic uncertainty, political tension, and global conflict. For example, one emerging trend is the rising volume of searches like “will AI take my job” a reflection of growing anxiety around artificial intelligence and automation.
By combining this search data with a time-series technique called Granger causality, we aim to uncover whether certain societal shifts, such as economic stress or technological disruption, can statistically predict increases in public anxiety.
Who This Article Is For
This article is designed for both technical and business audiences.
If you're a data scientist, analyst, or technologist, you'll find code snippets and modeling techniques that show how tools like Granger causality and Google Trends can be applied in real-world, exploratory research.
If you're on the business or strategy side, don't worry — the insights and visualizations are explained in clear, accessible language. You’ll be able to follow the narrative and understand how data science can reveal meaningful patterns in public behavior and sentiment, even without writing a single line of code.
Our goal is to bridge the gap between technical capability and strategic understanding.
Objective
The goal of this analysis is twofold:
Detect patterns of public concern over the last 10 years by tracking search trends across themes like anxiety, layoffs, pandemics, protests, and war.
Test directional relationships using Granger causality to answer questions such as: Does increased concern about artificial intelligence taking jobs precede a rise in searches related to public anxiety or job security fears?
Ultimately, we want to go beyond descriptive trends and explore whether public emotion, as reflected in search data, can be partially forecasted by measurable technological and societal shifts.
Disclaimer
This analysis is intended to demonstrate the kinds of insights that can be uncovered through public search data and data science methodology. While the patterns revealed here are informative, they should not be interpreted as conclusive evidence of causality or public behavior on their own.
To make well-informed decisions or build predictive systems, it would be necessary to incorporate additional data sources, domain expertise, and deeper contextual analysis. This work serves as a foundation for exploring how data science can be used to detect and interpret societal signals.
Data Overview
We used Google Trends data from 2015 to 2025, pulled via the Pytrends API for the United States. Keywords were grouped thematically into seven categories:
Mental Health (e.g., “anxiety,” “therapy,” “panic attack”)
Economy (e.g., “inflation,” “layoffs,” “will AI take my job”)
Weather (e.g., “heatwave,” “flood,” “weather anxiety”)
Politics (e.g., “election,” “protest,” “immigration policy”)
Health Crises (e.g., “pandemic,” “covid,” “sick leave”)
Social Tension (e.g., “racism,” “police brutality,” “crime rates”)
Global Conflict (e.g., “Israel,” “Palestine,” “WW3”)
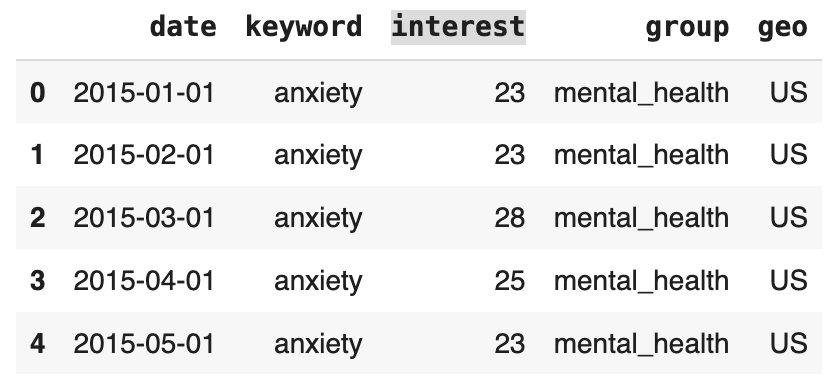
Each keyword’s relative interest over time was collected monthly and labeled with its theme and geography (U.S. level).
Explaining the Data Collection Process
To analyze public concerns over time, we used the Pytrends library — an unofficial Python client for the Google Trends API. This allowed us to automatically collect historical search interest data for a wide range of keywords, grouped by theme.
Key Steps:
Used Pytrends: A Python client for the Google Trends API to collect historical search interest.
Defined Keyword Themes:
Grouped 35+ keywords into 7 categories: mental_health, economy, weather, politics, health_crises, social_tension, global_conflict.
Geographic Scope: Focused on the U.S. as a whole (geo_scope = ['US']), but scalable to individual states.
Built Keyword Payloads: For each group, we requested weekly search interest from Jan 2015 to June 2025.
Cleaned and Reshaped Data: Removed partial/incomplete data, unpivoted the table for analysis, and labeled each row with its keyword group and region.
Merged All Results: Appended all keyword group data into one unified DataFrame: all_data.
Handled API Limits: Added a 2-second pause between each API request to respect Google’s rate limits.
Saved Final Dataset: Exported the combined dataset as google_trends_grouped_2015_2025.csv for further analysis.
from pytrends.request import TrendReq
import pandas as pd
import time

# Initialize pytrends
pytrends = TrendReq(hl='en-US', tz=360)

# Define keyword groups
keyword_groups = {
    "mental_health": ["anxiety", "therapy", "panic attack", "insomnia", "anxiety medication"],
    "economy": ["inflation", "layoffs", "ai", "chatgpt"],
    "weather": ["heatwave", "flood", "snowstorm", "hurricane", "weather anxiety"],
    "politics": ["election", "war", "protest", "president", "immigration policy"],
    "health_crises": ["covid", "flu", "pandemic", "long covid", "sick leave"],
    "social_tension": ["police brutality", "racism", "violence", "crime rates", "lawyers near me"],
    "global_conflict": ["war in Ukraine", "Palestine", "Israel", "Middle East conflict", "WW3"]
}

# You can also change this to a list of U.S. states if needed (e.g., ['US-CA', 'US-NY'])
geo_scope = ['US']  # full US, or use ['US', 'US-CA', 'US-TX'] for states

# Store all data
all_data = pd.DataFrame()

# Loop through geo locations and keyword groups
for geo in geo_scope:
    for group_name, keywords in keyword_groups.items():
        pytrends.build_payload(keywords, timeframe='2015-01-01 2025-06-18', geo=geo)
        df = pytrends.interest_over_time()
        if df.empty:
            continue

        df = df.drop(columns=["isPartial"])
        df = df.reset_index().melt(id_vars="date", var_name="keyword", value_name="interest")
        df["group"] = group_name
        df["geo"] = geo

        all_data = pd.concat([all_data, df], ignore_index=True)
        time.sleep(2)

# Save to CSV
all_data.to_csv("google_trends_grouped_2015_2025.csv", index=False)
print("✅ Data saved with keyword groups and optional state tagging.")
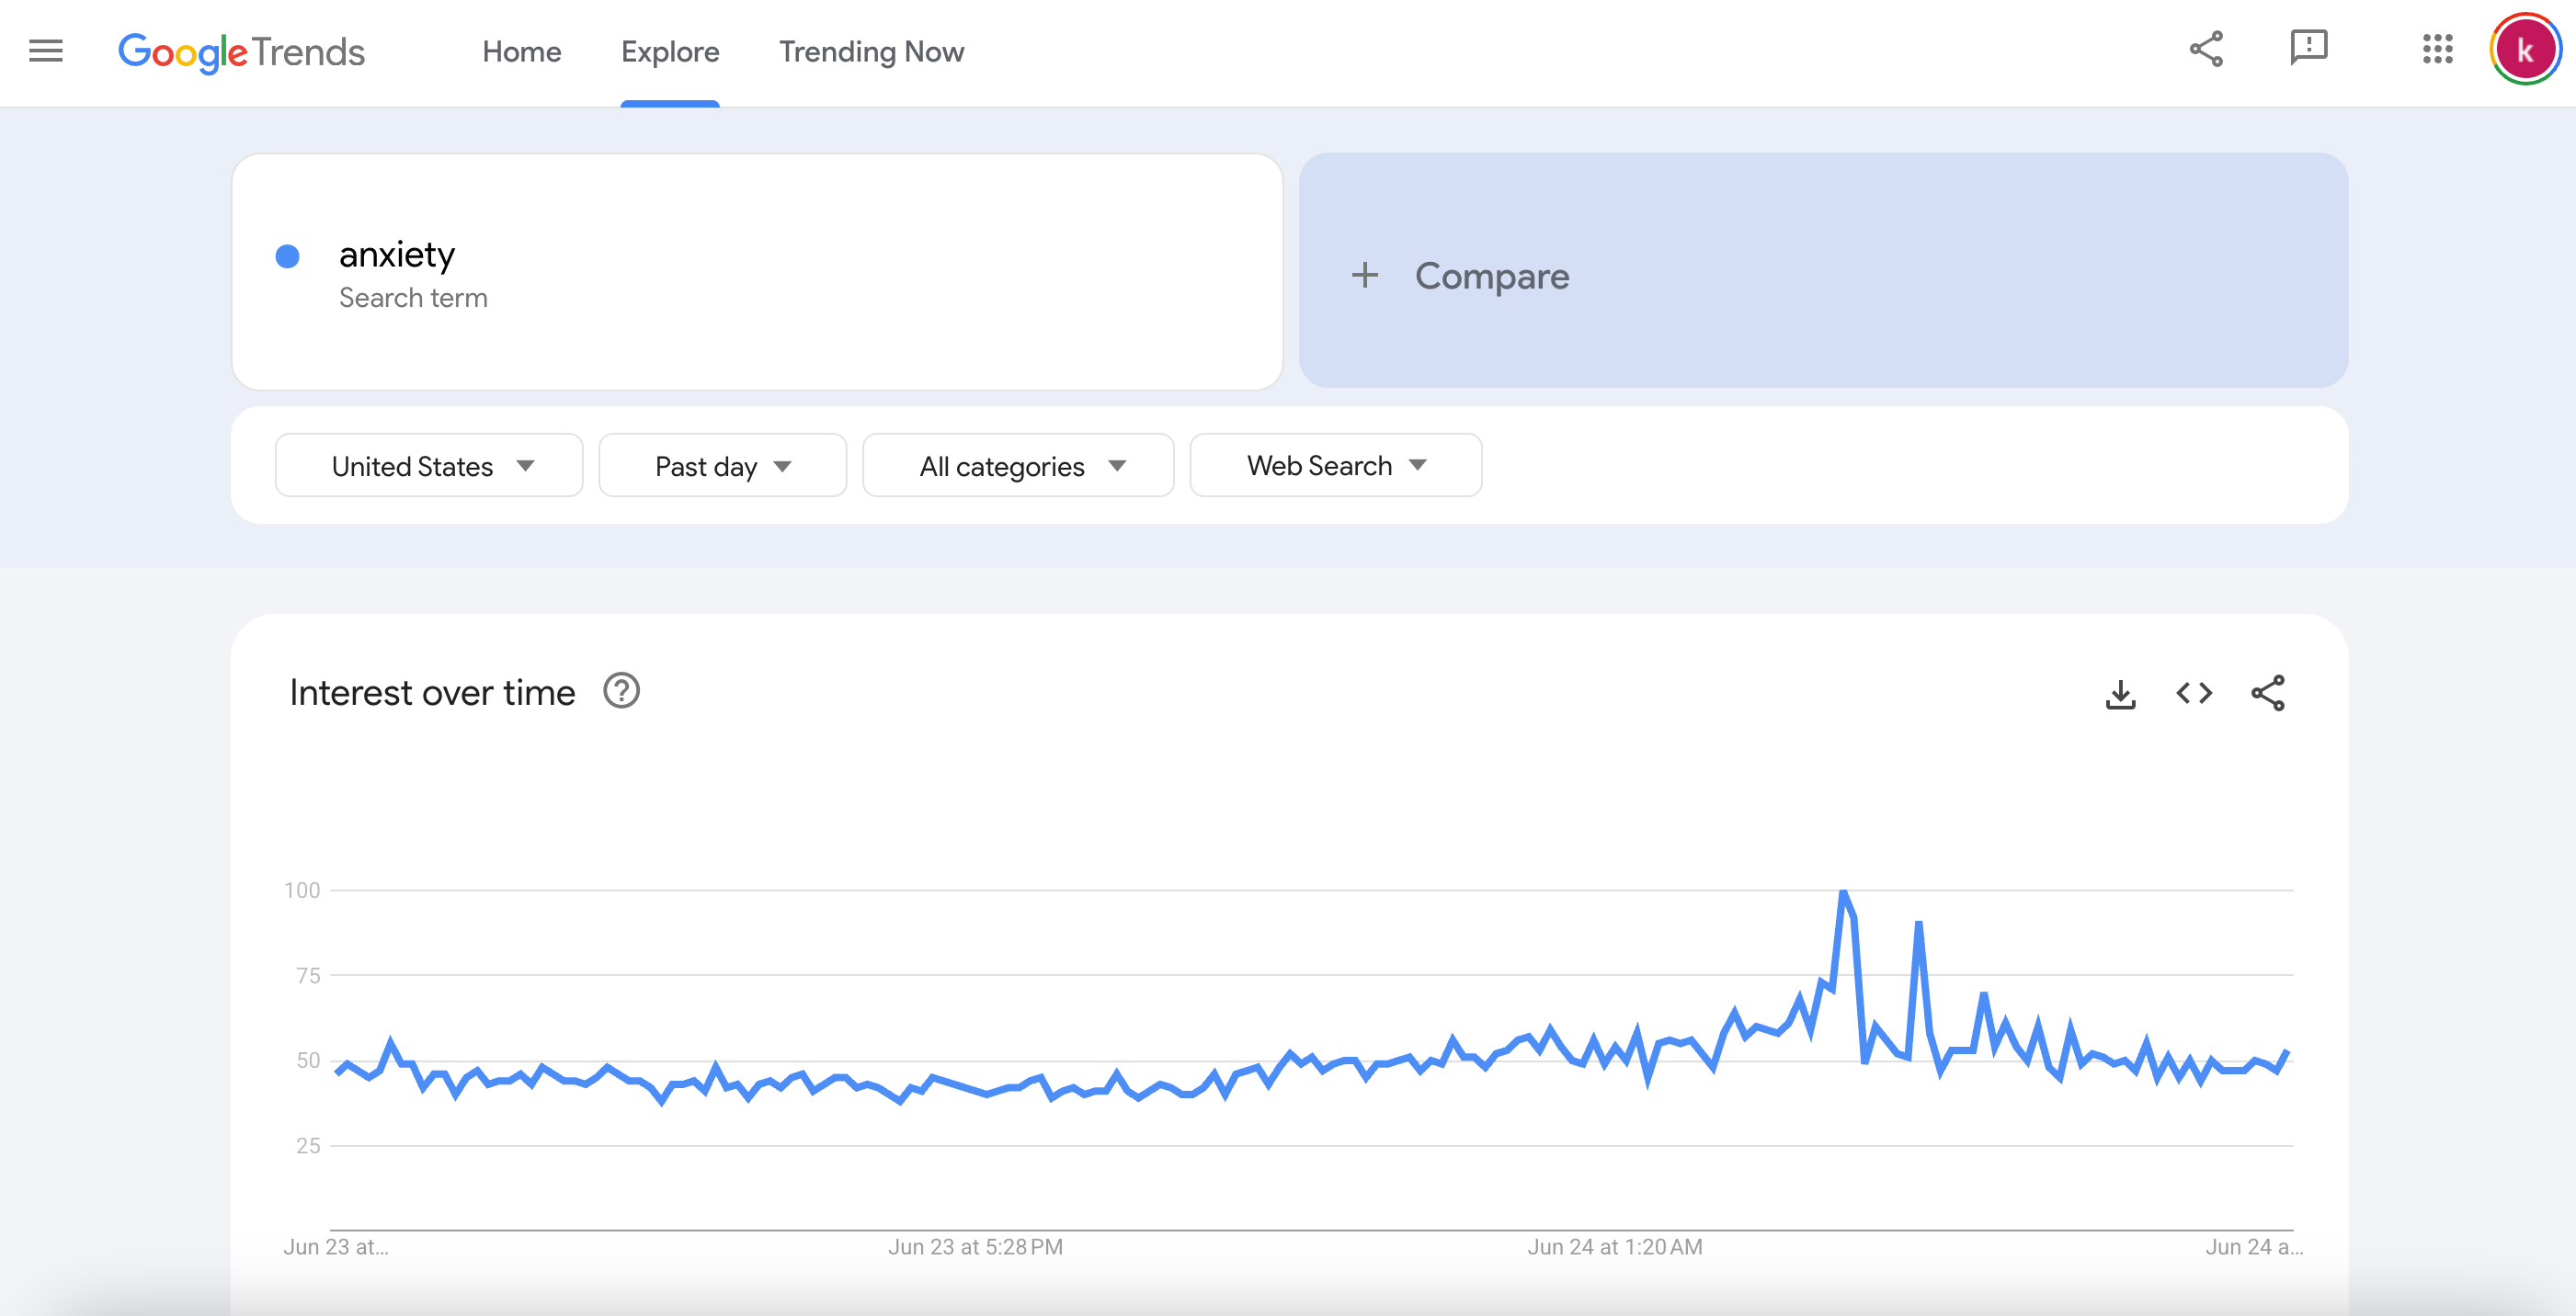
Visualizing Public Anxiety Over Time
We begin our analysis by examining the search interest for the keyword “anxiety” across the U.S. from 2015 to 2025.
anxiety_df = df[df['keyword'] == 'anxiety'].copy()

chart = alt.Chart(anxiety_df).mark_line().encode(
    x=alt.X('date:T', title='Date'),
    y=alt.Y('interest:Q', title='Interest over Time'),
    color='geo:N',
    tooltip=['date:T', 'interest:Q', 'geo:N']
).properties(
    title='Google Trends Interest for "anxiety" over Time (by Geo)'
).interactive()

chart
This line chart shows a steady upward trend in anxiety-related searches.
Notable spikes appear around early 2020 (pandemic onset), late 2022, and early 2025, indicating rising societal pressure or major stress-inducing events.
The baseline of search interest appears to shift upward after each major spike, suggesting long-term elevation in public concern around mental health.
This persistent rise in anxiety search volume may reflect not just temporary shocks like COVID-19, but deeper structural anxieties, possibly influenced by AI disruption, remote work culture, or political polarization.
Therapy as a Response to Anxiety: Search Trends
After visualizing the rising search interest in “anxiety,” we turn to its most common coping strategy: therapy. Google Trends data offers a striking view into how the public has increasingly sought help over time.

The search interest for “therapy” has shown a strong and consistent upward trend, rising from ~50 to near 100 over the last decade.
There is a clear acceleration after 2020, with more intense growth around 2022–2025.
The peaks suggest seasonal or event-based triggers, but the overall growth pattern points to a normalization and destigmatization of therapy in the U.S.
The rising interest in therapy may reflect not just a reaction to crises but a cultural shift—therapy is no longer just for when things fall apart; it's increasingly seen as part of maintaining emotional resilience in an unstable world.
The Rise of AI Anxiety: Fear of Job Loss
As artificial intelligence technologies rapidly advance and dominate headlines, public concern about their impact on employment has grown sharply. We analyzed Google Trends data for the phrase “will AI take job” to measure the digital footprint of this fear.
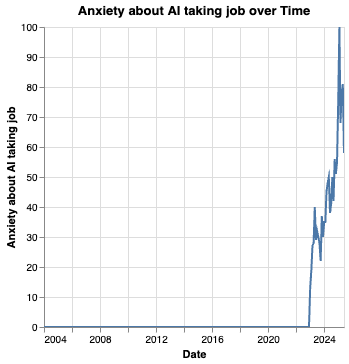
There is virtually no search activity before 2020 — then a dramatic spike begins around late 2022, coinciding with widespread awareness of tools like ChatGPT.
Interest climbs rapidly and consistently through 2023 and into 2024, with several major peaks suggesting public anxiety is intensifying.
The curve resembles an exponential pattern, reflecting how quickly AI job-related fear has entered mainstream public consciousness.
This isn't just curiosity — the data shows a real sense of urgency. As AI enters more industries, workers are turning to Google not just for answers, but for reassurance about their future.
Comparing Search Trends Side-by-Side: Bidimensional Analysis
To go beyond isolated trends, we now analyze how multiple concerns evolve together over time. This lets us examine relationships between two or more public anxieties, such as “anxiety” and “therapy”, or “AI” and “layoffs.”
To do this, we created a pivot table, which transforms our dataset so that:
Rows represent dates
Columns represent search keywords
Cells contain search interest values (from Google Trends)
This format allows us to:
Plot multiple keywords on the same chart
Measure correlation
Forecast multiple variables together
Test directional relationships (e.g., with Granger causality)
pivot_table = df.pivot_table(index='date', columns='keyword', values='interest')
pivot_table = pivot_table.fillna(0)
This gives us a clean, time-aligned matrix of all search terms.
Missing values (e.g., if a keyword wasn’t searched that week) are filled with
0.

Keyword Correlation: What Concerns Move Together?
To understand how different public concerns may be related, we calculated the Pearson correlation between all keyword search trends over the 10-year period. This allows us to explore which topics rise and fall together, potentially revealing shared emotional drivers or overlapping media cycles.
import plotly.graph_objects as go

# Compute correlation
correlation_matrix = pivot_table.corr()

# Create heatmap
fig = go.Figure(data=go.Heatmap(
    z=correlation_matrix.values,
    x=correlation_matrix.columns,
    y=correlation_matrix.index,
    colorscale='RdBu',
    zmin=-1,  # ensures red = -1, blue = +1
    zmax=1,
    colorbar=dict(title="Correlation"),
    text=correlation_matrix.round(2).astype(str),
    hoverinfo="text"
))

fig.update_layout(
    title="Keyword Correlation Heatmap (All Values)",
    xaxis_nticks=len(correlation_matrix.columns),
    height=800,
    width=1000
)

fig.show()

Darker blue cells represent stronger positive correlations (closer to +1).
For example, keywords like “anxiety”, “therapy”, and “panic attack” show strong alignment — suggesting they rise together in response to similar societal stressors.Lighter or red cells indicate weak or negative correlations (closer to 0 or -1).
Some economic terms like “inflation” and “AI” appear more distinct, with moderate or selective correlations depending on timing.You can also see clusters of concern — groups of keywords that tend to be part of the same emotional or news-driven narrative.
One surprising connection is the positive correlation between 'AI' and 'anxiety', which may reflect how economic disruption fuels personal stress.
Keyword Correlation Network: Mapping the Web of Public Concern
After the Pearson correlation heatmap, we wanted to take the analysis a step further and explore how strongly different public concerns are interconnected. Instead of looking at individual correlations in a matrix, we created a correlation network — a visual graph where:
Each keyword is a node
Connections (edges) are drawn between keywords with a correlation above a chosen threshold (in our case, |0.6|)
The stronger the relationship, the clearer the link appears in the network
This approach helps uncover clusters of public concern — showing which issues tend to spike together in search trends, possibly driven by the same real-world events or shared emotional drivers.
import networkx as nx
import matplotlib.pyplot as plt

# Define threshold
threshold = 0.6

# Extract edges
edges = [(i, j, round(correlation_matrix.loc[i, j], 2))
         for i in correlation_matrix.columns
         for j in correlation_matrix.columns
         if i != j and abs(correlation_matrix.loc[i, j]) > threshold]

# Create network
G = nx.Graph()
G.add_weighted_edges_from(edges)

# Plot
plt.figure(figsize=(12, 10))
pos = nx.spring_layout(G, seed=42)
nx.draw(G, pos, with_labels=True, node_color='lightblue', edge_color='gray', node_size=2000, font_size=12)
nx.draw_networkx_edge_labels(G, pos, edge_labels={(i, j): w for i, j, w in edges})
plt.title("Keyword Correlation Network (>|0.6|)")
plt.show()

Key Insights from the Network:
AI Cluster
“AI”, “will AI take job”, and “ChatGPT” form a tightly connected future-of-work cluster.
Their correlation exceeds 0.90, highlighting rising anxiety around job security in the age of automation.
Mental Health & Economic Pressure Cluster
Terms like “anxiety”, “therapy”, “layoffs”, “inflation”, and “insomnia” are densely linked.
Suggests a shared emotional landscape — financial strain and job instability fueling mental health issues.
COVID-Pandemic-Long COVID Chain
The search chain from “pandemic” → “COVID” → “long COVID” shows persistent health anxieties even years after the outbreak.
These terms maintain high correlations (>0.9), indicating continued public concern.
Sociopolitical Clusters
“Israel” and “Palestine” form a conflict-focused pair (0.90), likely driven by geopolitical events.
Similarly, “police brutality” and “protest” remain strongly correlated, reflecting periods of civil unrest.
Summary & Next Steps:
This exploration began with a simple question: Can what people search online reveal their collective fears? Through a 10-year lens of Google Trends data, we uncovered patterns that mirror America’s shifting concerns, from mental health struggles and economic instability to rising anxieties about artificial intelligence.
By using time-series data and correlation analysis, we took the first step in understanding how different fears move together, and which ones may signal others. The next phase of this analysis will introduce Granger causality, a statistical method that tests whether one trend can reliably forecast another. This deeper dive will help us ask not just what people fear, but when and why that fear grows.
📺 YouTube: @learn.kenutopia
📸 Instagram: @kayla_utopia
💼 LinkedIn: https://www.linkedin.com/in/khaoula-ilaje/
📧 Contact: contact@kenutopia.com